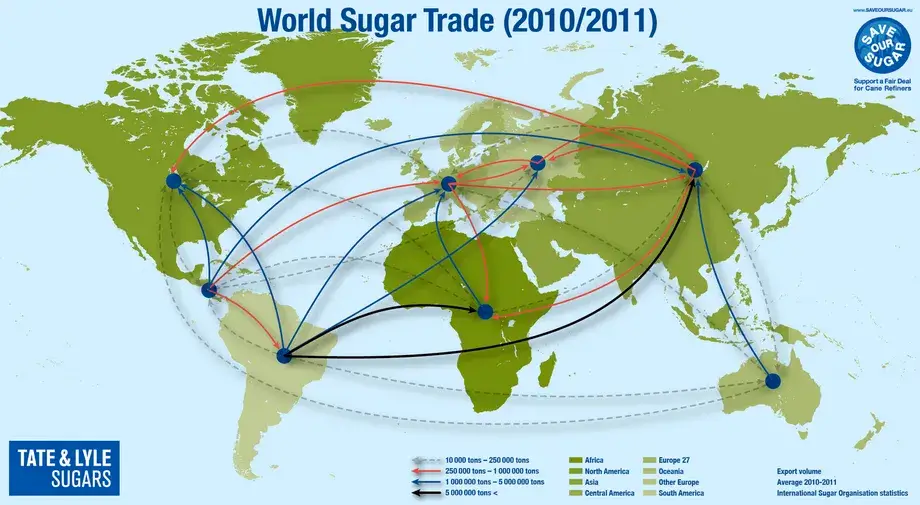
- Economic maps are used to represent various economic activities and resources of a region.
- These maps show the distribution of industries, trade routes, resources, and infrastructure in a particular area.
Features:
- Economic maps display different economic activities and resources of a region such as agriculture, manufacturing, and mining.
- They often include information on transportation infrastructure such as roads, railways, and airports.
- Economic maps can also show trade routes, ports, and markets in a region.
- They may use different symbols and colours to represent different economic activities or resources.
- Economic maps may also include information on population density and urbanization in a region.
- Economic maps may be produced at various scales, depending on the purpose and the intended audience.
- They may use satellite imagery, aerial photography, or ground surveys to gather data.
- Economic maps may also include textual information, such as statistics or descriptions of economic activities.
Uses:
- Economic maps are used by businesses, investors, and policymakers to make informed decisions about resource allocation, investment opportunities, and economic development.
- They are also used by researchers and academics to study the distribution and development of different economic activities and resources.
- Economic maps can also be used for educational purposes to teach students about the geography and economics of a particular region.
Drawbacks/Problems:
- Economic maps can be expensive to produce, especially if high-quality data is required.
- They may be subject to errors or inaccuracies due to incomplete or outdated data.
- Economic maps may also oversimplify complex economic systems, which can lead to misinterpretation or misunderstanding.
- There is a risk that economic maps may be used for political or commercial purposes, which can bias the representation of economic activities or resources.


